
Click HERE for Control Manuals and Documents
What is a Pipe Camera Assessment?
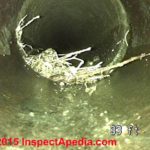
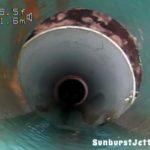
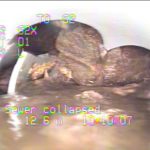
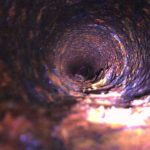
The pipe camera assessment is designed to provide the inspector with additional information regarding portions of the plumbing system which are not visible during the standard inspection process. To accomplish this, a high resolution camera attached to a 100′ push rod is inserted into the drain system (typically at a clean out – access point to plumbing drain pipe). Portions of the drain/sewage piping are viewed using the pipe scoping camera to determine if detectible indicators of pipe issues, damage, or functionality failures are present.
What Does the Inspector Look For?
During a pipe camera assessment, the basic items and indicators that the inspector is looking for includes, but is not limited to:
-Type of pipe material
-The presence of problematic or dated material
-Indicators of tree root entry
-Indicators of pipe separation
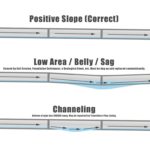
-Indicators of pipe ‘fall’ or slope issues
-Indicators of pipe ‘bellies’ or ‘channeling’ (low spots/deterioration of pipes)
-Indicators of blockage/foreign objects in pipes
-Indicators of improper pipe connections
Do All Buildings Need a Pipe Camera Assessment?
The short answer is no. We do not recommend a PCA for new construction or any home which remains under a builder/contractor warranty. Additionally, if the home is scheduled for static testing or specific inspections by plumbing specialists, a PCA is not recommended. Although pipe issues may be present at any property, some site specific factors will increase the likelihood of issues at buried plumbing. These factors include, but are not limited to:
-Systems surpassing 20 years in age
-Structures containing dated or problematic plumbing material
-Large trees/root systems near structure/buried plumbing material
-Structures having undergone foundation settlement and/or repair
-Structures in areas of known expansive soils and elevated ground swell
-Structures having undergone significant structural alteration/additions
-Structures having undergone unprofessional or unpermitted updates/repairs
-Structure with current plumbing issues and/or known previous issues
PIPE CAMERA ASSESSMENT LIMITATIONS:
The limited plumbing camera assessment is not designed or intended to diagnose specific issues, isolate exact locations of areas of concern, or determine the degree/significance of damage (if discovered). Rather, this limited assessment is intended to provide additional, basic information in regards to plumbing material and signs of possible functionality issues or material damage. All noted information and concerns should be assessed, verified, and remedied as needed by a licensed plumbing professional. Multiple limitations to the camera assessment are present and additional issues may go undiscovered during the limited assessment.
Multiple assessment limitations reduced the ability to fully investigate the system and additional issues/concerns, both minor and significant, may be present. The camera assessment process is not designed to be intrusive, destructive, or all encompassing. Rather, the plumbing camera assessment is intended to provide additional, basic information in regards to the buried drain line material determine is obvious, physical damage is present at the areas viewed through the camera. No work or information which requires specific licensing outside of those held by the operating inspector has been, or will be performed. This 3rd party assessment and report has been provided to the client and representing agents for the purposes of due diligence, filing of available information, and additional client protection. The assessment process and report do not, in any manner, represent a guarantee of warranty of the above mentioned property or associated system conditions. For a full analysis of the plumbing system, please call a licensed plumbing specialist.
ADDITIONAL FOUNDATION INFORMATION:
Below is some additional information that may be helpful when discussing foundation concerns with clients and potential buyers.
EVIDENCE OF FOUNDATION ISSUES:

 Evidence of foundation issues in not always as obvious as the pictures provided, however, there are several common visual signs to look for when viewing a structure.
A few common signs of foundation issues include, but are not limited to:
-Gapping Cracks at Foundation Wall: Cracks With Gap Wider Than a Nickel
-Stair Stepping Cracks at Brick/Stone: With Gaps in Crack Wider Than a Nickel
-Separation at Window/Siding Connections: Uneven Separation at Exterior Framing
-Issues Opening/Closing Windows
-Issues Opening/Closing Doors
-Doors ‘Ghosting’: Swinging Open/Closed On Their Own (Uneven)
-Diagonal Cracks (With Gaps in Cracks) at Interior Drywall
-Significant Cracks/Damage to Tile Flooring
-Known Issues with Plumbing: Backing Up of Sewage
Some additional factors that must be taken into account are:
-Age of Structure
-Size of Structure
-Area/Soil Type of Structure Location
-Natural Slope of Surrounding Land
-Grading and Drainage Issues
-Foundation Type
-Any Known/Disclosed Factors
-Survey Information Taken or Available
SETTLEMENT CRACKS THAT DO NOT INDICATE FOUNDATION FAILURE:

 SHRINKAGE CRACKS
Common shrinkage cracks at exposed slab flooring (porches, garages, etc.) can often be mistaken as signs of foundation issues to the untrained eye. Hairline cracks due to material curing (drying) is common on all slabs (both pictures show common shrinkage cracking).

 SETTLEMENT VS. COMMON CRACKS
Under normal circumstances, small drywall cracks with little or no separation are considered common and cosmetic in nature. Often, these cracks will be horizontal or vertical and follow a drywall joint (left photo). Diagonal cracks with notable gaps at the damage area may indicate a presence of foundation issues (right photo).
The following link provides a report produced by Texas A&M AgriLife extension. Information and recommendations in this report will aid in protecting a structure built on expansive clay foundations.
Maintenance of Existing Foundations on Expansive Clay/Problematic Soils
FOR MORE INFO:
TAHI SERVICES PLLC
512-788-1001
CLICK HERE FOR FURTHER INFORMATION REGARDING GROUNDING AND BONDING OF MAIN AND SUB PANELS
CLICK HERE OR SEE BELOW FOR CODE INFORMATION REGARDING CODE STANDARDS FOR GROUNDING/BONDING OF METAL PLUMBING PIPES
CLICK HERE FOR ADDITIONAL INFORMATION REGARDING CODE STANDARDS FOR GROUNDING/BONDING OF METAL PLUMBING PIPES (IN A DOWNLOADABLE FORMAT)
CLICK HERE FOR MANUFACTURER INFORMATION REGARDING GASTITE PRODUCTS
Article 250—Grounding and Bonding 250.30(A)(4) Electrode
Section 250.30(A)(4) has been revised and simplified, and Exception No. 1 was deleted. There is no longer a hierarchy of electrodes that must be used for grounding separately derived systems. The revision clarifies that the building grounding electrode system must be used when establishing a grounding electrode for a separately derived system. If installed outdoors, the grounding electrode for the separately derived system must comply with 250.30(C).
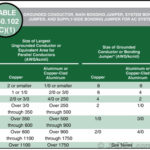
250.104(A) Metal Water Piping
Section 250.104(A) has been revised by adding “if or sufficient size” to (A)(3) and (A)(4). The wording “that is interconnected to form a building frame” has been added to subdivisions (C) and (D). The minimum bonding conductor or jumper sizes must be in accordance with Table 250.102(C)(1) rather than 250.66.
250.122(F)(2) Multi-conductor Cables
Section 250.122(F)(2) has been revised and arranged in a list format. The revisions address minimum sizes for equipment grounding conductors (EGCs) in multiconductor cables in parallel arrangements. A single EGC in each cable can be connected in parallel at each end and connected to a full-size EGC sized based on the overcurrent protection device for the entire circuit.
Article 300—General Requirements for Wiring Methods and Materials 300.5(D) Protection From Damage
Electrical metallic tubing (EMT) has been added to the list of raceways permitted to provide physical protection for direct-buried conductors and cables emerging from grade EMT, and associated elbows, couplings and fittings are permitted to be installed in concrete, in direct contact with the earth, approved as suitable for the condition. Section 358.10(B) requires that, where EMT is used in this manner, it must be where protected by corrosion protection and approved as suitable for the condition.
300.5(G) Raceway Seals
The general requirements of first-level subdivision 300.5(G) are now correlated with sections 225.27 and 230.8. Where necessary, spare or unused raceways shall also be sealed. The type of sealants applied must be identified for use with the cable insulation, conductor insulation, bare conductor, shield or other components.
300.22(B) Ducts Specifically Fabricated for Environmental Air
A new exception in 300.22(B) correlates requirements for wiring in ducts specifically fabricated for environmental air between the NEC and NFPA 90A. NFPA 90A permits cables that are “directly associated with the air distribution system” and not to “exceed four feet.” This revision correlates existing requirements within the NEC. For example, in Chapter 8, first-level subdivision 800.113(B) contains the same permission.
Table 310.15(B)(3)(c)
Table 310.15(B)(3)(c), containing rooftop temperature correction factors, has been deleted. Raceways or cables must be installed a minimum distance of ⅞-inch above the roof. Where installed less than ⅞-inch above the roof to the bottom of the raceway or cable, use a temperature adder of 60°F.
314.27(E) Separable Attachment Fittings
New subdivision (E) permits a new product referred to as a “separable attachment fitting.” This product is a listed locking support and mounting receptacle used in combination with compatible attachment fittings designed for the support of luminaires, paddle fans and so forth. These devices are designed to facilitate quick and easy interchange of luminaires or other equipment.
328.14 Installation
Section 328.14 requires type MV cable to be installed, terminated and tested by qualified people. NECA 600 2014, Standard for Installing and Maintaining Medium-Voltage Cable, has been added to the Informational Note. It provides valuable information on installation requirements, guidelines for qualified installers, cable splicing and more.
Residential Construction Guidelines
Engineered Lumber/Beam Sandards
TO DOWNLOAD INDUSTRY INFORMATION: CLICK HERE
ATTIC VENTILATION INFO PROVIDED BY BUILDING SCIENCE DIGEST:
CLICK HERE
SOFFIT INFORMATION PROVIDED BY SPRAY FOAM MAGAZINE: CLICK HERE
FOAM INSULATION AND HVAC SYSTEMS: CLICK HERE
NAHB TECHNICAL NOTES: CLICK HERE
INDUSTRY/ACADEMIC STUDY: CLICK HERE
DIRECT LINK TO THIS FIELD STUDY:
FBC_FINAL_REPORT-061616
Final Report:
Field Study and Analytical Assessment of Sealed Attics Conducted for the State of Florida
Project #: 00125306 ______________________________________________________
Submitted to:
Prepared by:
David O. Prevatt, Ph.D., PE (MA)
Principal Investigator
Associate Professor (Structures)
Anshul Shah, Aravind Viswanathan, Mitali Talele
Graduate Students
University of Florida
WA Miller, Ph.D., Philip Boudreaux, Simon Pallin, Ph.D., Kaushik Biswas, Ph.D., Tony Gehl,
Jerry Atchley, Nicklas Karlsson, Dominic Bednar, Roderick Jackson, Ph.D.
Oak Ridge National Laboratory, Building Envelope
________________________________________________________________________________
Engineering School of Sustainable Infrastructure and Environment
Department of Civil and Coastal Engineering
University of Florida
365 Weil Hall
P.O. Box 116580
Gainesville, FL 32611-6580
__________________________________________________________________________________TABLE OF CONTENTS
LIST OF FIGURES
Figure 1: Illustration of vented attics and unvented attics (Grin et al. 2013) 2
Figure 2: Cross-Section of sealed attic showing placement of thermistors, relative humidity sensors and moisture pins in demonstration homes. 6
Figure 3: Minneapolis duct blaster 7
Figure 4: House 1 in West Palm Beach, FL 10
Figure 6: Two Duct Blaster fitted into the attic 10
Figure 5: Blower Door Test 10
Figure 7: Digital and Infrared Picture of West-facing Ceiling Wall 11
Figure 8: Digital and Infrared Picture of the South-facing Roof and Attic 11
Figure 9: Outdoor and attic ambient temperature and relative humidity for two contiguous days of data collected for house 1 in West Palm Beach, FL 12
Figure 10: The indoor ambient temperature and relative humidity for two contiguous days of data collected for House 1 in West Palm Beach, FL 13
Figure 11: House 2 in Venice, FL 14
Figure 12: Duct Blasters fitted into the attic 14
Figure 13: Total duct leakage test for first floor 15
Figure 14: Total duct leakage test for second floor 15
Figure 15: Digital and Infrared pictures of the attic under the South-facing roof 16
Figure 16: Digital and Infrared pictures of the attic 16
Figure 17: Outdoor and attic ambient temperature and relative humidity for two contiguous days of data collected for house 2 in Venice, FL 17
Figure 18: Indoor ambient temperature and relative humidity for two contiguous days of data collected for House 2 in Venice, FL 18
Figure 19: The partial pressure of water vapor is shown for the roof deck and attic for two contiguous days of data collected for House 2 in Venice, FL 18
Figure 20: House 3 in Orlando, FL 19
Figure 22: Blower Door Test 20
Figure 21: Duct Blaster connected to return vent 20
Figure 23: Infrared and visual images of the insulated roof decks in the attic 21
Figure 24: The outdoor and the attic ambient temperature and relative humidity for two contiguous days of data collected for House 3 in Orlando, FL 21
Figure 25: The indoor ambient temperature and relative humidity for two contiguous days of data collected for House 3 in Orlando, FL 22
Figure 26: House 4 in Gainesville 23
Figure 27: Infrared and Visual images of an insulated roof deck. 24
Figure 28: Outdoor and attic ambient temperature and relative humidity for two contiguous days of data collected for house 4 in Gainesville, FL 25
Figure 29: The partial pressure of water vapor is shown for the roof deck and attic for two contiguous days of data collected for House 4 in Gainesville, FL 25
LIST OF TABLES
Table 1: Description of Florida Homes Selected for Field Demonstration 4
Table 2: Salient Features of the Selected Homes 5
Table 3: Instruments Scanned by Campbell CR1000 Micro-Logger 7
Table 4: House 1 Air Leakage Test Results 11
Table 5: House 2 Air Leakage Test Results 15
Table 6: House 3 Air Leakage Test Results 20
Table 7: House 4 Air Leakage Test Results 23
ABBREVIATIONS:
ACH Air changes per hour
BEopt Building Energy Optimization Software
ccSPF closed cell Spray Polyurethane Foam
FBC Florida Building Commission
FRSA Florida Roofing and Sheetmetal Association
HVAC Heating, Ventilation and Air Conditioning
ocSPF open cell Spray Polyurethane Foam
RH Relative Humidity
Executive summary
Four residential homes across the state of Florida were selected for conducting a field study to assess the performance of non-ventilated and semi-conditioned attics sealed with spray foam insulation. The purpose of this research is to evaluate the hygrothermal (heat and moisture flow) performance and durability of sealed attic construction where expanded foam insulation is applied directly to the underside of the roof deck.
Field sites are in Florida climate zones CZ-1A and CZ-2A (also ASHRAE climate zones 1A and 2A) where the weather is hot and humid. The homes are instrumented for measuring temperature and relative humidity of the indoor living space, the outdoor air and the attic air. In addition, the temperature, relative humidity and moisture content of the roof sheathing are being monitored and recorded by data acquisition equipment. Air leakage tests on the whole house, on the sealed attic and in the HVAC ducts were conducted on all four homes. Digital and infrared images were captured to document the thermal performance of the sealed attics. Field tests commenced June 1, 2016. The Florida Roofing and Sheet Metal Association (FRSA) supported the Roofing Technical Advisory Committee (TAC) of the Florida Building Commission (FBC) in finding interested homeowners willing to participate in the field study. The FRSA also made a $40k donation to the project through the University of Florida Foundation in order to expand the project to 4 home demonstrations and to support field acquisition and reduction of field data beyond the project end date of June 30, 2016. Data acquisition will continue for one full year through the critical hot and humid summer months as well as Florida’s mild winter season.
Results of blower door testing for the whole house showed all homes to have air exchange rates less than 5 ACH with exception of the home in Orlando which had 9.6 ACH. The attic for the home in West Palm Beach did not appear well sealed and had an ACH of 35, which is high. The attics of homes in Venice and Orlando were sealed to an ACH of 5 and 8 respectively. Three of the four homes had about 4 to 5-in of open cell spray polyurethane foam applied to the underside of the roof decks. The other home had 7-inches applied to the underside of the deck. Digital and infrared images of the roof deck and attic floor infer that the heat flow crossing the attic floor was lowest for the home with 7-in of spray foam; it having the largest thermal resistance to heat flow.
Homeowners commented that they were very pleased with the performance of their sealed attics and did not notice any water problems in or around the attic. Temperature and relative humidity field measures of the attic air and the sheathing revealed good hygrothermal performance in 3 of the 4 homes. Moisture content of the sheathing did not exceed the threshold for mold growth. The residence in Gainesville, FL however performed differently; it showed the attic relative humidity to increase during the late afternoon hours on a hot and humid day. As the attic air temperature increases the relative humidity should drop. The homeowner occupies the home during the winter but vacates the home during the summer and sets the thermostat at 80∞F. Field data shows the setting may not enable the air-conditioner to adequately dehumidify the conditioned space. Moist air makes its way through the ceiling and into the sealed attic. The spray foam (being permeable) allows the water vapor to diffuse through the foam toward the sheathing. The movement occurs when the roof sheathing is colder than the attic air, during the late evening as night-sky radiation cools the roof. If the roof sheathing is colder than the dew point of the attic air, then condensation occurs on the underside of the sheathing. It is these phenomena which ORNL/UF are interested in better understanding for determining risk assessment and building modifications that would minimize the risk for condensation in the roof deck and improve building durability.
DISCLAIMER
This report presents the findings of research performed by the University of Florida and Oak Ridge National Laboratory. Any opinions, findings, and conclusions or recommendations expressed in this report are those of the authors and do not necessarily reflect the views of the sponsors, partners and contributors.
- INTRODUCTION
About 77% of single-family homes in the southern U.S. are built with slab-on-grade foundations, U.S. Census Bureau (2013). The statistic is higher in Florida where almost all homes feature slab-on-grade foundations. These homes typically have a HVAC system per floor, and the units conditioning the home are placed in the attic. The convenience of the attic space appeals to builders, who all too often install the HVAC unit and the ducts in the attic to conserve living space while completing the rough-in at a low first cost. However, installing the HVAC and ducts inside an unconditioned and ventilated attic is not the most energy efficient option because of the extreme summer and winter operating temperatures occurring in the attic. Parker, Fairey and Gu (1993) simulated the effects of ducts on space conditioning Florida homes and observed that air leakage and heat transfer to the duct were major contributors to the peak electrical burden on the FL utility. Walker, I.S. (1998) in his bibliography of duct air leakage reports average measured leakage rates of roughly 7% to a maximum of 20% of the supply airflow. Air leakage rate is the volume of air movement per unit time across the building envelope including airflow through joints, cracks or a combination of mechanical pressurization and de-pressurization, natural wind pressures, or air temperature differentials between the interior and exterior of the building envelope. To improve envelope performance, researchers opted to literally encapsulate the HVAC and ducts by moving the boundary of the insulating planes to the roofline, gables and eaves of the attic. The concept was first introduced by Building Science Corp (Rudd and Lstiburek, 1998). They built and monitored test homes in a hot, dry climate and demonstrated that the prototype homes with unvented attics yielded significant cooling and heating energy savings over a conventional home with ventilated attic. Transforming residential attics into a non-ventilated semi-conditioned attic space has therefore gained approval among builders, Chasar et al. (2010). Boudreaux, Pallin and Jackson (2013) however recommend that sealed attics be conditioned to mitigate the moisture buildup issue as do Roppel, Norris and Lawton (2013). However, field data demonstrating successful implementation in all climates are sparse and there still remains an educational gap in the best practices for builders. The dearth of data in hot, humid climates has caused confusion among builders and code officials because of the confounding variables affecting the hygrothermal performance of sealed attics.
The 2010 energy conservation supplement to the Florida Building Code (FBC) provided measures for putting the supply and return ducts inside the building thermal envelope (Section 403.2, 2010 of FBC). However, the code change while intending to minimize risk and improve efficiency may be counterproductive. In 2014 changes were enacted to section 806.4 of the FBC for unvented and sealed attics. The modification to Section 806.4.4 requires that air impermeable insulation be applied to the underside of the roof sheathing. If instead an air permeable insulation is selected, then the builder must include sheet insulation above the deck for condensation control. Field studies conducted by ORNL in a hot, humid climate investigated the thermal and hygrothermal performance of ventilated attics and non-ventilated semi-conditioned attics sealed with open-cell spray polyurethane foam (ocSPF) and with closed-cell spray polyurethane foam (ccSPF) insulation, (Miller et. al 2016). In the ventilated attics the relative humidity drops as the attic air warms; however, the opposite was observed in the sealed attics. Peaks in measured relative humidity in excess of 70 to 90% were found to occur from solar noon until about 8 PM on hot, humid summer days. Moisture pin measurements made in the wood roof sheathing and absolute humidity sensor data from inside the foam and from the attic air suggest that moisture is transferred through the foam and into the sheathing of sealed attics, Lstiburek (2015).
-
- PURPOSE
The purpose of this project is to monitor four single-family residential structures constructed with sealed attic systems and document the air tightness of the home, the duct system and the sealed attic. An additional two homes will also be monitored using funds provided by the Florida Roofing and Sheet Metal Contractors Association (FRSA). The moisture content of the wood roof decks, the indoor ambient, outdoor ambient and attic ambient relative humidity and temperature will be recorded for a 12-month period. The data from this project will be used to check for moisture intrusion and storage in attics sealed with spray foam insulations.
-
- OBJECTIVE
The goal of the project is to document the risk potential and the effects upon occupant comfort in Florida homes that are sealed using ocSPF or ccSPF. Four residential field demonstrations are setup across the state of Florida to acquire field data. The project will focus on Florida homes that have the attic sheathing, gables, eaves and soffits sealed using open-cell spray polyurethane foam (ocSPF), closed-cell spray polyurethane foam (ccSPF) insulations or similar sealed system. Attics sealed with blown fiber insulations are also candidate systems for the study. Field data will be reduced and used to assess the potential of moisture storage in the foam and sheathing which can lead to structural damage to the sheathing. The storage of moisture has also been found to affect the indoor relative humidity level causing it to sometimes exceed prescription in ASHRAE Standard 55.
- BACKGROUND INFORMATION
Conventional attic construction provides a continuous air flow through the attic’s soffit vents and out ridge or gable vents, Figure 1. Conventional attics are referred to herein as unconditioned, vented attics; and, it is not part of the buildings thermal envelope. In contrast, a non-ventilated, semi-conditioned (sealed) attic is made part of the thermal envelope. It is encapsulated with polyurethane spray foam, and any duct leakage of conditioned air is exploited to semi-condition the attic, Figure 1. The efficiency “feature” of putting ducts in conditioned or semi-conditioned space is typically one of the most energy-savings features, with the potential to be one of the most cost-effective.
Figure 1: Illustration of vented attics and unvented attics (Grin et al. 2013)
Polyurethane foams consist of two components, an A-side and a B-side. Both the components are mixed on site before spray application. The A-side is a mixture of 50% methylene diphenyl diisocyanate and 50% polymeric methylene diphenyl diisocyanate, two chemicals which are highly reactive when mixed with water or each other. When both the components are mixed, an exothermic reaction produces low-conductivity gases or water, making the B-side a blowing agent. This causes bubbles to form, and the curing of such bubbles determines the density of the foam. Water-blown foams have low densities and are open cell foams. They are permeable to vapor transmission and are non-structural, but have high resistance to air flow.
Ecologic (2009) differentiates open cell spray polyurethane foam (ocSPF) from closed cell spray polyurethane foam (ccSPF). The density of open cell foams ranges from 0.5 to 1.2 lb per cubic foot, with thermal resistance R-values ranging from R-3.6/inch to R-4.5/inch. The two leading manufacturers of ocSPF are Sealection500 and Icynene. When applied, this foam instantly expands more than 100 times its original size. The density of ccSPF ranges from 1.7 to 2.2 lb per cubic foot, with R-values ranging from R-5/inch to R-7/inch.
Open-cell spray polyurethane foam (ocSPF) is vapor permeable, having a vapor permeance of about 16 perms for a 3-in thickness of foam. In comparison closed-cell spray polyurethane foam (ccSPF) insulation is impermeable and has a permeance of about 0.8 Perm for a 2½-in thickness of foam.
- Scope of work
Work was performed as outlined in the proposal from UF to the Florida Building Commission (FBC) “SOW UF to FBC Final 111115.docx,” which is restated as follows:
-
- Task 1. Conduct Survey of FLorida Homes and Select Candidate Field Sites
Miller and Boudreaux (2015) described how some homes with sealed attics perform well in energy while others did not. This paper suggested several potential reasons for this variability. Poor workmanship was attributed as a real problem. Improper constructions cause gaps in roof to wall connections, thus leading to air leakage. Ueno and Lstiburek (2015) developed a vapor permeable ridge venting system that protects the roof sheathing by minimizing the moisture content accumulation between spray foam insulation and the wood sheathing.
Therefore, a key goal of this study is to survey and document as many homes as possible for the potential risk of moisture damage to the sheathing and the risk that the interior building relative humidity increases above ASHRAE Standard 55 guidelines.
From the survey conducted, four houses were selected as field demonstrations. Information gathered about the four houses helped to determine the position of temperature sensors and moisture pins in the attic. A questionnaire was prepared that would be completed by the homeowners, to help document occupancy habits and salient features of the homes.
-
- Task 2. – Setup Four Field Demonstrations and Collect Field Data
Air leakage testing was conducted on the selected homes to document whole house, attic-to-outside, and living-to-attic air leakage as well as total duct leakage. Portable data loggers were installed in the sealed attics. The loggers will continuously measure air temperature and relative humidity of the outdoor ambient, the indoor ambient and the attic. The roof sheathing temperature and humidity and roof sheathing moisture content will also be recorded continuously for the study.
Blower door, duct blaster and guarded blower door tests were carried out to quantify the air tightness of the house and the duct leakages. The questionnaire prepared was completed by the homeowners. This questionnaire has details about the dimensions of the house, dimensions of openings, details of HVAC system and the spray foam insulation etc. The temperature and moisture sensors are fitted in the attic in the predetermined positions. The sensors are connected to a portable data logger which wirelessly transmits the data to ORNL.
- Setup of four field demonstrations
The FRSA identified 12 home sites from which the following four homes were selected for field study, as listed in Table 1. Site selection was based on the homes being setup with unventilated, semi-conditioned attics, the type of roof system, placement of the HVAC and the occupation of the homeowner. Homeowners who are builders or who are closely related to construction were given preference because the home’s workmanship was better managed by the homeowner, which would hopefully eliminate the effects of poor roof and attic workmanship that could cause water leakage and confound the study.
Table 1: Description of Florida Homes Selected for Field Demonstration
-
- Homeowner Survey
An Internal Review Board at ORNL developed a survey for the homeowners participating in the field study. The survey provided general information about the study regarding why the study is being conducted, who is involved in the study, length of time the study lasts, potential issues with house damage, and how the data will be used and reported. All homeowners signed the survey; a sample is provided in Appendix B for review.
University of Florida students took dimensions of each single family residence, including the dimensions of all rooms in the conditioned space of the houses. In addition, the students recorded the slope and style of the roofs, the roof structure, size of the attic and the type and dimensions of the spray foam insulation. The exterior wall cladding and details, number and dimensions of exterior windows and foundation were recorded for later use in BEopt model development, Christensen et al. (2006). Homeowners were asked when the attic was sealed and by what Florida contractor. The survey included questions about the heating, ventilation and air-conditioning (HVAC) system and duct work in the attic. The insulation was installed during initial construction in three of the four houses, and it was added during retrofitting of the fourth house. The owner who retrofitted their home with spray foam insulation was happy with the reduction in heating and cooling utility bills after the retrofit. The peak summer electric bill dropped from about $250 to $150, a 40% reduction. Appendix C contains results of the questionnaires for all four homeowners. Table 2 provides a succinct summary of features for each home.
Table 2: Salient Features of the Selected Homes
Abbreviations: NA, not applicable; ocSPF, open-cell spray polyurethane foam; oc, on center; OSB, oriented strand board;
Ply, plywood; RT, refrigerant ton; Conc., concrete; WRB, weather resistive barrier; R-Max, polyisocyanurate foam sheathing
-
- Data Acquisition System
Campbell Scientific model CR1000 micro-loggers were setup for remote acquisition and recording of field data. The loggers are equipped with 4 MB of memory, rechargeable battery, a 115 Vac-to-24 Vdc transformer, cellular modem and associated cables. The micro-loggers take measurements of all sensors (Table 3) every 30 seconds and reduce analog signals to engineering units. Averages of the reduced data are written electronically to an open file (internal on logger) every 15 min. Averages are calculated over the 15-min interval and are not running averages; they are reset after each 15-min interval. The electronic format is comma-delimited for direct access by spreadsheet programs. Software running on a server at ORNL is configured to remotely collect data at scheduled intervals from all micro-loggers via cellular connection. Data are stored in server archive which has routine backup for data protection.
4.3 Setup of Instrumentation
Absolute humidity probes and moisture pins were installed on the adjacent roof decks to analyze the in situ performance of the attics. Absolute humidity sensors were fabricated using the technique described by Straube, Onysko and Schumacher (2002). A thermistor and relative humidity probe were packaged together in a vapor permeable and liquid water repellent cover fabricated from commercially available weather resistive barriers designed to allow passage of water vapor but not liquid water. Thermistor and humidity sensors were calibrated by the manufacturer. ORNL Metrology made checks for a couple of the absolute humidity probes. The probes met the manufactures specification for the temperature response of +/- 0.2°C. Humidity sensors were checked at 25, 50, 75 and 90 % RH. The error in RH ranged from 2% of reading at 25% RH and 15°C to 6.5% of reading at 90% RH and 26°C.
The sensors were placed in the same pattern for each home to provide consistent comparisons among the attics under field study. Figure 2 shows the placement of sensors. Absolute humidity probes were installed for measuring the outdoor, the indoor and the attic ambient temperature and relative humidity. Absolute probes were also placed on the underside of the roof sheathing about mid-span from eave to ridge. An absolute probe was also placed on the sheathing at the north-side of the roof ridge.
Figure 2: Cross-Section of sealed attic showing placement of thermistors, relative humidity sensors and moisture pins in demonstration homes.
One set of moisture pins were nailed into the underside of the sheathing adjacent to the absolute probes centered between rafters for both north pitch locations (Figure 2). In addition, a second set of pins were installed to the underside of sheathing about 1-in from the rafter for each north pitch sensor location.
Table 3: Instruments Scanned by Campbell CR1000 Micro-Logger
- Description of field demonstrations
- Air Leakage Testing Procedures
Studies suggest air duct leakage account for as much as 25% of total house energy loss, and in many cases has a greater impact on energy use than air infiltration. Leaks can cause conditioned air to be dumped directly outside or in the attic or crawlspace rather than delivered to the building. The impact on a particular building will depend on the size of the air duct leak, its location and whether or not the leak is connected to the outside.
The Duct Blaster test apparatus (Figure 3) consists of a Duct blaster fan, a DG-700 Digital Pressure Gauge and a flexible duct. The DG-700 gauge has two separate measurement channels which allow simultaneous monitor and display of the duct system pressure and the airflow through the Duct Blaster fan during the duct airtightness test. The Duct Blaster fan is controlled by a variable fan speed controller. The 12 ft long flexible extension duct is used to connect the Duct Blaster fan to the duct system of the building.
The round transition piece connects to either the fan exhaust flange (pressurization testing) or the fan inlet flange (depressurization testing), while the square transition piece can be attached directly to the air handler cabinet. The extension duct allows the Duct Blaster fan air flow to be easily directed to the duct system.
The Total Leakage Pressurization Test is used to measure the duct leakage rate in the entire duct system when the duct system is subjected to a uniform test pressure. The Total Leakage Pressurization Test measures duct leakage to the outside of the building. The air flow through the Duct Blaster fan required to pressurize the duct system to the test pressure is the measured total duct leakage rate.
The air leakage tests performed in each house were:
- Duct Blaster Test – To determine the total duct leakage,
- Guarded Duct Blaster Test – To determine the duct leakage to the unvented attic,
- Blower Door Test – To determine the airtightness of the house, and
- Guarded Blower Door Test – To determine the attic leakage to the outdoor ambient.
-
-
- Duct Blaster Test – To determine the total duct leakage
-
-
A total duct leakage test was conducted to measure the leakage rate in the entire duct system, when the ducts are subjected to a uniform test pressure. The total duct leakage test measured both the duct leakage to the conditioned and unconditioned spaces. To perform the total duct leakage pressurization test, one end of the flexible extension duct was connected to the exhaust of the duct blaster fan and the other side was connected to the return vent of the duct system. All supply vents were blocked, with the duct pressure being measured through one supply vent. A multi-point pressurization test was performed by pressurizing the duct system in the order of 20, 25, 30, 35, 40 Pascals. The test took 5 minutes to complete.
The duct blaster fan forces air into the duct system and this air eventually escapes out through the gaps and joints in the duct system to the conditioned and unconditioned spaces of the house. This air leakage rate is measured in cubic feet per minute (cfm) using the DG700 pressure gauge of the duct blaster. TECLOG software was used to calculate the air leakage rates and the air leakage area in the duct system.
To perform the total duct leakage depressurization test, one end of the flexible extension duct was connected to the suction of the duct blaster fan and the other side was connected to the return vent. The duct baster fan was used to depressurize the duct system in the order of 20, 25, 30, 25, 40 Pascals. The test took 5 minutes to complete.
When the fan sucks the air from the duct system, the air in the conditioned and unconditioned spaces flows into the cracks of the ductwork and out of the fan. This air leakage rate was measured in cfm using the DG700 pressure gauge of the duct blaster system. TECLOG1 above software is used calculate the air leakage rates and the air leakage area in the duct system.
-
-
-
- Guarded Duct Blaster Test – To determine the duct leakage to the unvented attic
-
-
The duct-leakage to the unvented attic in House 1 could be measured directly, since the attic hatch was in the garage and not to the conditioned space. To determine the duct leakage into the attic, one duct blaster fan was connected to the return of the duct system and a blower door brought the home to the same pressure as the ducts. This negates any airflow between the duct system and the interior of the home, thus the measured leakage is only the duct leakage to the attic. The pressurization test was conducted by pressurizing the attic and the duct system in the order of 10, 15, 20, 25, 30 Pascals. The test took 10 minutes to complete.
To perform a multi-point depressurization test, the home was depressurized by one blower door fan, while the duct system was depressurized by using the duct blaster fan. The pressure in the duct system was varied by order of 10, 15, 20, 25, 30 Pascals. The duct leakage into the attic space was found out using the TECLOG1 above software.
-
-
-
- Blower Door Test – To determine the airtightness of the house
-
-
To determine the airtightness of the building envelope, the home is left in usual condition (with attic hatch and garage door closed). The blower door fan is used to pressurize and depressurize the house. This test determines the total leakage out of the building envelope due to constructional leaks – through gaps in doors and windows, gaps in the roof to wall and wall to ceiling connections.
The blower door fan was fitted to an external door and all doors and windows were closed. The house was pressurized and depressurized by the blower door fan. The amount of pressure was automatically calibrated by TECTITE software based upon the inputs such as indoor temperature, outdoor temperature, and elevation.
-
-
-
- Guarded Blower Door Test – To determine the attic leakage to the outside of the house
-
-
The guarded blower door test was conducted to determine the attic leakage to the outside of the house. This test was conducted by fitting a blower door to an exterior door and two duct blasters to the attic. Two duct blasters were used since one duct blaster fan was not sufficient to pressurize the attic to the required test pressure, Figure 5. This configuration negates any leakage between the attic and the home since they are both at the same pressure. Therefore, the flow through the duct blaster fans is a measure of the leakage in the attic to the outside.
When the blower door fan and the duct blaster fans were operated by utilizing the TECLOG1 above software, the blower door fan was used to pressurize the conditioned space. The duct blaster fans were used to pressurize the attic. The blower door fan maintained the test pressure inside the house, the air blown through the duct blaster escaped through the leaks to the outside of the attic. The test pressures were in the order of 30, 35, 40, 45, 50 Pascals. The same test was carried out for depressurization testing as well. The test pressures were the same and both tests took about 20 minutes to complete in total.
-
- House 1: Standing Seal Metal Roof with ocSPF sealed attic
House 1 is located in West Palm Beach, FL within ASHRAE Climate Zone 1A, defined as hot-humid by ASHRAE 169 (2006) and Florida climate zone (CZ-1A). A hot-humid climate is defined as a region that receives more than 20 inches (50 cm) of annual precipitation and where one or both of the following occur:
- A 67°F (19.5°C) or higher wet bulb temperature for 3,000 or more hours during the warmest six consecutive months of the year; or
- A 73°F (23°C) or higher wet bulb temperature for 1,500 or more hours during the warmest six consecutive months of the year.
August is the warmest month in West Palm Beach, Florida with an average high temperature of 90.5°F. The hottest day on record was September 28, 2004 when the temperature hit 102.0°F. During January the average overnight temperature drops to 55.9°F with the lowest temperature of 23.0°F being recorded on December 26 1983. The average annual precipitation recorded for West Palm Beach is 62.4 inches.
Figure 4 shows images of the residence from different directions. This single-story residence has a sealed attic with hip roofs. The home features a standing seam metal roof.
Figure 4: House 1 in West Palm Beach, FL
-
-
- AIR LEAKAGE TESTING RESULTS
-
The following air leakage tests were performed in the house:
- Duct Blaster Test – To determine the total duct leakage
- Guarded Duct Blaster Test – To determine the duct leakage to the unvented attic
- Blower Door Test – To determine the airtightness of the house (Figure 6), and
- Guarded Blower Door Test – To determine the attic leakage to the outdoor ambient
Table 4: House 1 Air Leakage Test Results
-
-
- Infrared and Digital Pictures of Attic and Interior Ceiling
-
The attic of House 1 is constructed of 2 by 4 trusses that are 24-in on center. The ocSPF was sprayed to a depth of 4-in yielding R-15 of thermal protection for the roof and attic. The Florida Building Code (2014) requires new homes to have R-30 insulation placed on the attic floor of unconditioned, ventilated attics.
Infrared image of the ceiling shows the gypsum to have a temperature of about 81∞F, Figure 7. The ceiling is not insulated and is only about R-0.45 for ½-in gypsum. Miller et al. (2016) observed that sealing the attic with less than code level of insulation causes the heat flowing through the ceiling to be almost double that crossing the ceiling for an unconditioned, ventilated attic. Digital and infrared images of the attic were taken to view heat leakage into the attic, Figure 8. The south-facing roof deck reads about 90∞F. Radiation is the major contributor of heat transfer from the roof deck to the ceiling, and the 9∞C temperature gradient shows there is significant heat flux entering the conditioned space. More spray foam insulation would improve the thermal performance of the attic.
Figure 7: Digital and Infrared Picture of West-facing Ceiling Wall
Figure 8: Digital and Infrared Picture of the South-facing Roof and Attic
-
-
- Field Results for Sealed Attic
-
Two contiguous days of data for House 1 display the outdoor ambient dry bulb temperature and relative humidity along with the dry bulb temperature and relative humidity of the attic air, Figure 9. As expected, outdoor relative humidity readings fall as the outdoor air temperature increases, because the moisture bearing capacity of the air also increases. By definition of relative humidity (partial pressure of water vapor in air to the partial pressure of water vapor at saturation for the same temperature and pressure of the actual state) it should drop, Figure 9. The temperature and relative humidity of the attic air are both less than that observed for the outdoor ambient. There is no unusual trend observed in this sealed attic.
Figure 9: Outdoor and attic ambient temperature and relative humidity for two contiguous days of data collected for house 1 in West Palm Beach, FL
The indoor ambient condition for the same two contiguous days is also displayed in Figure 10.The homeowners control the indoor ambient to about 77∞F (25∞C). The indoor relative humidity fluctuates from 50% to almost 80%. At 80% RH the home is at the boundary for comfort but is acceptable because the air temperature remains at about 23.3 to 30.3°C by ASHRAE 55 (2013).
Figure 10: The indoor ambient temperature and relative humidity for two contiguous days of data collected for House 1 in West Palm Beach, FL
-
- House 2: Concrete Tile Roof with ocSPF sealed attic
House 2 is located in Venice, FL within Climate Zone 2A, defined as hot-humid by ASHRAE 169 (2006), and Florida Energy Climate Zone (FECZ) 2. The warmest month in Venice is August with an average high temperature of 90.6°F. The hottest day on record was June 29 1977 when the temperature hit 99.0°F. During January the average overnight temperature drops to 51.2°F with the lowest temperature of 32.0°F being recorded on January 4 2012. The average annual precipitation in Venice is 50.5 inches. Figure 11 shows images of the residence from four different directions.
Figure 11: House 2 in Venice, FL
-
-
- Air Leakage Testing and Results
-
For House 2 the duct leakage to the attic could not be determined directly, so instead the duct leakage to the conditioned space was measured then subtracted from the total duct leakage results to yield duct leakage to the attic. To determine the duct leakage into the conditioned space, one duct blaster fan is connected to the return vent and one duct blaster fan is connected into the attic opening, Figure 12.
To determine the airtightness of the building envelope, the attic hatch is left open (since the pressure boundary should be the unvented attic roof) and the blower door fan is used to pressurize and depressurize the house. This test determines the total leakage out of the building envelope due to constructional leaks – through gaps in doors and windows, gaps in the roof to wall and wall to ceiling connections, Figure 13 and 14.
Table 5: House 2 Air Leakage Test Results
-
-
- Infrared and Digital Pictures of Attics and Interior Ceiling
-
The attic of House 2 is constructed of 2 by 4 trusses that are 24-in on center. The ocSPF was sprayed to a depth of 5½-in yielding R-21 of thermal protection for the roof and attic. The Florida Building Code (2014) requires new homes to have R-38 insulation placed on the attic floor of unconditioned, ventilated attics.
Infrared image of the ceiling shows the gypsum to have a temperature of about 79∞F, Figure 15. The ceiling is not insulated and is only about R-0.45 for ½-in gypsum. Digital and infrared images of the attic were taken to view heat leakage into the attic, Figure 16. The south-facing roof deck reads about 84∞F. Again, radiation is the major contributor of heat transfer from the roof deck to the ceiling, and the 5∞F temperature gradient shows there is less heat flux entering the conditioned space as compared to House 1. However, more spray foam insulation would improve the thermal performance of the attic.
Figure 15: Digital and Infrared pictures of the attic under the South-facing roof
Figure 16: Digital and Infrared pictures of the attic
-
-
- Field Results for Sealed Attic
-
Figure 17 presents 48 hours of test data collected from the instrumentation installed in House 2, and displays the outdoor ambient dry bulb temperature and relative humidity along with the dry bulb temperature and relative humidity of the attic air. As expected, the outdoor air temperature increases, the outdoor relative humidity drops. The temperature and relative humidity of the attic air are both less than that observed for the outdoor ambient and there is nothing unusual observed for air in this sealed attic. The relative humidity in the attic is surprisingly low. The owner installed an UltraAir dehumidifier to help support the HVAC remove moisture from the conditioned space. The roof is concrete tile placed on battens. The tile roof reduces the heat flux incident on the underlying roof deck and therefore less moisture from the roof deck is driven into the attic air during peak irradiance.
Figure 17: Outdoor and attic ambient temperature and relative humidity for two contiguous days of data collected for house 2 in Venice, FL
The indoor ambient condition for the same two contiguous days is also displayed in Figure 18.The homeowners control the indoor ambient to about 77∞F (25∞C). The indoor relative humidity fluctuates from 50% to 60%, which yields an excellent comfort conditions that is acceptable by ASHRAE 55 (2013).
Partial pressures of the OD ambient, ID ambient, north- and south-facing sheathing, the foam surface and attic air are displayed to illustrate the hygrothermal performance of the attic system, Figure 19. The partial pressure of water vapor in the outdoor ambient is almost always greater than partial pressures in the sheathing, attic and indoor conditioned space. Sealed attics investigated by Miller et al. (2016) in a hot-humid climate have shown the partial pressure in the attic and the foam insulation to exceed the outdoor ambient pressure, indicating the potential storage of moisture in the roof deck. The Venice home shows partial pressures at the roof deck and ridge to be larger than that in the attic and there is the potential for diffusion of water vapor from the deck to the attic air; however, relative humidity measures of the attic air (Figure 19) show the diffusion effect marginal. Water vapor pressure in the attic (a semi-conditioned space) is slightly higher than that of the indoor conditioned space, Figure 19. However, Figure 18 shows that the two TRANE heat pumps and UltraAir dehumidifier have sufficient capacity to remove the latent load. It should also be noted that the homeowner is a builder who closely managed the construction of the home. The workmanship of the spray foam sealing was excellent. The attic was very clean and well setup with ductwork. Air-handler units were not in the attic. Only the UltraAir dehumidifier was in the attic.
Figure 18: Indoor ambient temperature and relative humidity for two contiguous days of data collected for House 2 in Venice, FL
Figure 19: The partial pressure of water vapor is shown for the roof deck and attic for two contiguous days of data collected for House 2 in Venice, FL
-
- HOUSE 3: Asphalt Shingle Roof with ocSPF sealed attic — HVAC outside
House 3 is located in Orlando, FL within Climate Zone 2A, defined as hot-humid by ASHRAE 169 (2006) and Florida Energy Climate Zone (FECZ) 2. Summers are long, very warm, and fairly humid. Daily thunderstorms are the norm. Winters are mild with periodic invasions of cool to occasionally cold air. July and August are the warmest months in Orlando with an average high temperature of 91.5°F. The hottest day on record was July 2, 1998 when the temperature hit 101.0°F. During January the average overnight temperature drops to 48.6°F with the lowest temperature of 19°F being recorded on January 21, 1985. The average annual precipitation in Orlando is 53.2 inches.
The following images and text are related to House 3 in Orlando, Florida. Figure 20 shows images of the residence from four different directions. The two-story residence has both first- and second-floor attics. Based on accessibility, the attic sensors were located in a sealed, first-floor attic on the northwest part of the house, as shown in Figure 20.
Figure 20: House 3 in Orlando, FL
-
-
- Air Leakage Testing Results
-
Air Leakage Testing was performed to determine the airtightness of the house and the air leakage of the house. The air leakage tests performed were:
- Duct Blaster Test – To determine the total duct leakage of the house.
- Blower Door Test – To determine the airtightness of the house.
- Guarded Blower Door Test – To determine the attic leakage to the outside of the house.
To perform the total duct leakage pressurization test, one end of the flexible extension duct was connected to the exhaust of the duct blaster fan and the other side was connected to the return vent of the house, Figure 21. The blower door fan was fitted to an external door and all doors and windows were closed. The house was pressurized and depressurized by the blower door fan, Figure 22.
Table 6: House 3 Air Leakage Test Results
-
-
- Infrared and Digital Pictures of Attics and Interior Ceiling
-
The attic of House 3 is constructed of 2 by 4 trusses that are 24-in on center. The ocSPF was sprayed to a depth of 4-in yielding R-15 of thermal protection for the roof and attic. The Florida Building Code (2014) requires new homes in Climate zone 2A to have R-38 insulation placed on the attic floor of unconditioned, ventilated attics. Digital and infrared images of the attic were taken to view heat leakage into the attic, Figure 23. The southwest-facing roof deck reads about 90∞F. Again, radiation is the major contributor of heat transfer from the roof deck to the ceiling, and the roughly 10∞F temperature gradient shows that more spray foam insulation would improve the thermal performance of the attic.
Figure 23: Infrared and visual images of the insulated roof decks in the attic
-
-
- Field Results for Sealed Attic
-
The home is a split-foyer type with separate roofs protecting 1st and 2nd floors. The 2nd floor attic was not accessible because of its low 3/12 pitch. Another roof and attic covered the garage and a 3rd attic section was located on the northwest side of the home. The 3rd section served as the test attic. It did not contain ducts or HVAC. The home was well shaded on the west side of the home therefore the roof did not see much irradiance except around high noon. Two split-system air conditioners cooled the building. One air handler was placed in a closet with ductwork run between the 1st and 2nd floors to air-condition the 1st floor. The second unit was placed in a mud room. Its duct was directed up into the attic on the 2nd floor for supplying conditioned air to the upper floor.
Figure 24: The outdoor and the attic ambient temperature and relative humidity for two contiguous days of data collected for House 3 in Orlando, FL
Similar to house 1 and 2, as the outdoor air temperature increases, the outdoor relative humidity drops. The temperature and relative humidity of the attic air are both less than that observed for the outdoor ambient and there is nothing unusual observed for air in this sealed attic, Figure 24. Dark heat absorbing asphalt shingles are the roof cover; however, the roof is mostly shaded by trees during the day.
The indoor ambient condition for the test period of 48 hours is also displayed in Figure 25. The homeowners control the indoor ambient to about 77∞F (25∞C). The indoor relative humidity fluctuates from 45% to 50%, which yields an excellent comfort conditions that is acceptable by ASHRAE 55 (2013). The red arrow in Figure 25 is pointing to the RH scale along the secondary vertical axis.
Figure 25: The indoor ambient temperature and relative humidity for two contiguous days of data collected for House 3 in Orlando, FL
-
- HOUSE 4: Asphalt Shingle Roof with ocSPF sealed attic
House 4 is located in Gainesville, 40 minutes away from UF campus. Gainesville is classified as Climate Zone 2A being hot-humid by ASHRAE 169 (2006) and Florida Energy Climate Zone (FECZ) 2. Summers are long, very warm, and fairly humid. Daily thunderstorms are the norm. Winters are mild with periodic invasions of cool to occasionally cold air. July and August are the warmest months in Gainesville with an average high temperature of 91°F. The hottest day on record occurred in 1952 when the temperature hit 104°F. During January the average overnight temperature drops to 42°F with the lowest temperature of 10°F being recorded January, 1985. The average annual precipitation in Gainesville is 47.3 inches. The following images and text are related to House 4 in Gainesville, FL. Figure 26 shows images of the residence from different directions. This single-story residence has a sealed attic with hip roofs.
Figure 26: House 4 in Gainesville
-
-
- Air Leakage Testing Results
-
Air Leakage Testing was performed to determine the airtightness of the house and the air leakage of the house. The air leakage tests performed were:
- Duct Blaster Test – To determine the total duct leakage of the house
- Guarded Duct Blaster Test – To determine the duct leakage to the unvented attic
- Blower Door Test – To determine the airtightness of the house
- Guarded Blower Door Test – To determine the attic leakage to the outside of the house
Table 7: House 4 Air Leakage Test Results
-
-
- Infrared and Digital Pictures of Attics and Interior Ceiling
-
The attic of House 4 is constructed of 2 by 4 trusses that are 24-in on center. The ocSPF was sprayed to a depth of 7-in yielding R-27 of thermal protection for the roof and attic. The Florida Building Code (2014) requires new homes in Climate Zone 2A to have R-38 insulation placed on the attic floor of unconditioned, ventilated attics.
Digital and infrared images of the attic were taken to view heat leakage into the attic, Figure 27. The north-facing roof deck reads about 78∞F. The 7-in of ocSPF is in part the reason for a lower deck temperature which, in turn, will drop the radiation heat transfer to the attic floor.
Figure 27: Infrared and Visual images of an insulated roof deck.
-
-
- FIELD RESULTS FOR SEALED ATTIC
-
The owner of House 4 is retired and occupies the home only during the winter months. He turns the thermostat up to 80∞F during the summer months while he lives up north in Ohio. The setting causes the air-conditioner to remove less latent load from the home. Interestingly, the attic shows excessive amounts of water vapor during hot late afternoons. One day of data for House 4 displays the outdoor ambient dry bulb temperature and relative humidity along with the dry bulb temperature and relative humidity of the attic air, Figure 28. As the outdoor air temperature increases, the outdoor relative humidity drops. The attic air temperature is very similar to the outdoor air temperature because of the thermostat setting for the HVAC. The relative humidity in the attic appears steady at about 80% except during the late afternoon. Solar irradiance drives moisture stored in the roof deck back through the ocSPF and into the attic air. As result the relative humidity of the attic air becomes saturated from about 6 to 10PM. Saturated attic air implies the wood in the attic to be wet.
Partial pressures of the OD ambient, ID ambient, north- and south-facing sheathing, the foam surface and attic air are displayed to illustrate the hygrothermal performance of the attic system, Figure 29. The partial pressure of water vapor in the attic exceeds the water vapor pressure in the outdoor ambient during the late afternoon hours. By continuity of water vapor, the only way for this to occur is for moisture stored in the roof deck to be driven out into the attic. The water vapor pressures in the roof deck show the gradient is from the deck into the attic air during the late afternoon. Therefore, heat energy from the sun heats the deck and drives the moisture out of the deck and into the attic air. However, at night the reverse occurs. The partial pressure of water vapor in the attic is greater than that of the roof decks. Therefore, the attic’s water vapor diffuses back toward the roof deck which is colder because of night-sky radiation cooling the deck below the outdoor air temperature. The effect is cyclic with the diurnal cycle. Computer simulations are required to judge the amount of storage and accumulation of water vapor in the roof decks over the 1-year field study.
Figure 28: Outdoor and attic ambient temperature and relative humidity for two contiguous days of data collected for house 4 in Gainesville, FL
Figure 29: The partial pressure of water vapor is shown for the roof deck and attic for two contiguous days of data collected for House 4 in Gainesville, FL
- OUTCOME
The Building Envelope Systems Research Program at ORNL has factual data on sealed attic performance at two separate field demonstrations (Natural Exposure Test Facility in Charleston, SC and the Campbell Creek Home demonstration in Knoxville. TN). The studies helped formulate and benchmark a risk assessment methodology, Pallin et al. (2014). The technique predicts the risk of water damage to roof sheathing and the deviance of the conditioned space from the ASHRAE Standard 55 comfort conditions. ORNL has developed an exclusive capability to model and simulate the hygrothermal dynamics of sealed, semi-conditioned attics.
The ORNL/UF team identified homes in Florida with sealed attics from which field demonstrations were setup for documenting data of sealed attics in Florida climate zones CZ-1A and CZ-2A. Data collection commenced June 1, 2016. The FRSA has provided funds to continue data collection to enable assessment of the thermal and hygrothermal performance. A Go/noGo decision will be made based on the results of the field study by the FBC upon recommendation of the Roofing TAC. A Go decision will provide the opportunity to conduct work in parallel to the field study. ORNL would exercise and fine-tune the computer toolkit to Florida specific climate and to the Florida Energy Conservation Code (2014).
Simulations for the probabilistic modeling of CZ-1A and 2A will identify the key variables impacting indoor comfort and the durability of roof assemblies against moisture. As example, the overall airtightness of the building enclosure and indoor moisture supply has the highest impact on both the indoor climate and the moisture durability of an unvented attic roof construction. In addition, the moisture durability of the roof construction is very sensitive to air leakage rates that are not high enough to substantially affect the temperatures in the air leakage pathway through which it travels. Therefore the simulations would provide the Florida Building Commission guidelines (ranges of permissible air leakage rates) that would classify the risk for a given sealed attic construction. An acceptance criterion for a sealed attic job could be defined and used by the FBC to ensure good sealed attic design.
References
ASHRAE Standard 55, 2013. “Thermal Environmental Conditions for Human Occupancy,” 1791 Tullie Circle NE · Atlanta, GA 30329. www.ashrae.org.
ASHRAE Standard 169, 2013. “Climate Data for Building Design Standards,” 1791 Tullie Circle NE · Atlanta, GA 30329. www.ashrae.org.
Boudreaux, P., Pallin, S. and Jackson, R. 2016. “Investigation of the proposed solar driven moisture phenomenon in asphalt shingle roofs,” in Thermal Performance of the Exterior Envelopes of Buildings, XIII, proceedings of ASHRAE THERM XII, Clearwater, FL., Dec. 2016.
Chasar,D., Sherwin, J., vonSchramm, V., Chandra, S. 2010. “Measured Performance of Side-by-Side South Texas Homes,” ASHRAE Thermal Performance of the Exterior Envelopes of Whole Building XI International Conference.
Christensen, C., Andreson, R. and Horowitz, S. 2006.BEopt™ Software for Building Energy Optimization: Features and Capabilities. Technical Repot, NREL/TP-550-39929.
Florida Building Code, 5th Edition, 2014 Web site:
http://codes.iccsafe.org/app/book/toc/2014/Florida/Building%20Code/index.html.
Lstiburek, J.W. 2015. “Venting Vapor,” ASHRAE Journal Aug, 2015, p. 46 – 51.
Walker, I.S. 1998. Technical Background for Default Values used for Forced Air Systems in Proposed ASHRAE standard 152P. ASHRAE Trans. Vol.104 Part 1. (presented at ASHRAE TC 6.3 Symposium, January 1998. LBNL 40588.
Ueno, K., J. Lstiburek. 2015. “Field Testing Unvented Roofs with Asphalt Shingles in Cold and Hot-Humid Climates.” Building America Reports. Building Science Corporation. http://tinyurl.com/qaf267v
EcoLogic Energy Solutions 2009. “The Science of Spray Foam Insulation” http://www.ecologices.com/pdf/scienceofsprayfoam.pdf
- APPENDIX A: FRSA FLYER
Florida homeowners whose homes have the attic sealed with spray polyurethane foam or blown fiber insulation are welcome to participate in a 1-year field study with the University of Florida (UF) and the Oak Ridge National Laboratory (ORNL). In return, the homeowners will receive valuable information documenting the efficiency of their home. An assessment of the Home Energy Rating Score (HERS) will be provided as well as the results of blower door tests, the results of guarded blower door tests and duct blaster tests. These tests will reveal the air tightness of the home, the air tightness of the sealed attic and the air tightness of the duct system. Portable data loggers will be installed in each sealed attic. The loggers will measure air temperature and relative humidity of the outdoor ambient, the indoor ambient and the attic. The roof sheathing temperature and humidity and roof sheathing moisture content will also be recorded hourly for the duration of the study, Figure 1. All findings will be documented in a report that each participating homeowner can use to make informed economic decisions for improving the efficiency of their home.
OBJECTIVE
UF and the ORNL will field test 4 homes located in northern, central and southern Florida. The homes will have the attic sealed using open-cell spray polyurethane foam (ocSPF), closed-cell spray polyurethane foam (ccSPF) or blown fiber insulations. A key goal of this study is to document the thermal and hygrothermal performance of the sealed attics for the purpose of improving the cost effectiveness, durability, moisture resistance and efficiency of home construction. Results of the study will provide information for the Florida Building Commission (FBC) to use in strengthening the Florida building code.
BACKGROUND
The Florida Roofing and Sheet Metal Contractors Association (FRSA) is an alliance of companies actively engaged in upholding excellence in the roofing contracting business in the State of Florida. The FRSA and the Florida Building Commission (FBC) are sponsoring the UF and the ORNL to setup four Florida homes as field demonstrations to highlight and improve workmanship in residential construction.
APPENDIX B: IRB questions on SURVEY FORM
Title of Research Study: Field Study and Analytical Assessment of Sealed Attics Conducted for
the State of Florida [DOE Contract NFE-15-05910]
Investigators: Dr. William Miller (ORNL), David Prevatt (UF)
Why am I being invited to take part in a research study?
Florida residents whose homes have the attic sealed with spray polyurethane foam or blown fiber insulation are invited to participate in a 1-year field study with the University of Florida (UF) and the Oak Ridge National Laboratory (ORNL). The Florida Building Commission (FBC) is sponsoring the field study in support of the Florida building code. Participating homeowners will receive valuable information documenting the efficiency of their home. An assessment of the Home Energy Rating Score (HERS) will be provided as well as the results of blower door tests, the results of guarded blower door tests and duct blaster tests. Your home is well suited to the study because the attic contains the heating, ventilation and air-conditioning system and ductwork in an attic encapsulated by spray foam insulation or blown fiber insulation.
What should I know about a research study?
- Someone will explain this research study to you.
- Whether or not you take part is up to you.
- You can choose not to take part.
- You can agree to take part and later change your mind.
- Your decision will not be held against you.
- You can ask all the questions you want before you decide.
Who can I talk to?
If you have questions, concerns, or complaints, or think the research has hurt you, talk to the research team at the Oak Ridge National Laboratory, William Miller at (865) 574-2103 or at the University of Florida, David Prevatt at (352) 672-2660.
This research has been reviewed and approved by an Institutional Review Board (“IRB”). You may talk to them at (865) 574-4359 or [email protected] if:
- Your questions, concerns, or complaints are not being answered by the research team.
- You cannot reach the research team.
- You want to talk to someone besides the research team.
- You have questions about your rights as a research subject.
- You want to get information or provide input about this research.
Why is this research being done?
The Florida Roofing and Sheet Metal Contractors Association (FRSA) is an alliance of companies actively engaged in upholding excellence in the roofing contracting business in the State of Florida. The FRSA and the FBC are sponsoring the UF and the ORNL to setup four Florida homes as field demonstrations to highlight and improve workmanship in residential construction. A key goal of this study is to document the thermal performance of sealed attics and to better understand the movement of moisture in the sealed attics. Objective is to improve the cost effectiveness, durability, moisture resistance and efficiency of home construction. The conclusions of the study will provide information for the Florida Building Commission (FBC) to use in strengthening the Florida building code.
How long will the research last?
We expect that you will be in this research study for 1 full year beginning immediately after the air tightness of your home is characterized and a small micro-computer and instruments are installed in the attic.
How many people will be studied?
The homeowner’s opinions and perceptions are requested and therefore are part of the field study. We expect about 4 people will be in this research study out of 4 people in the entire study nationally.
What happens if I say yes, I want to be in this research?
- UF will be forwarding you a questionnaire documenting important structural and equipment features of your home which include overall house dimensions, wall height, date house built, roof sheathing, roof cover, attic insulation, roof insulation, roof slope, rafter and truss details, any soffit and/or ridge vents, type of spray foam or blown fiber insulation, when was attic sealed, did you have the attic sealed, perception of the sealed attic on energy savings and energy costs, have you noticed any signs of moisture damage in the attic, does the inside living climate feel comfortable, what is the HVAC equipment heating and cooling the home, is the HVAC and ducts in the attic, is the exhaust air from the house pumped into the attic.
- Soon a team will request visitation rights to conduct blower door, guarded blower door and duct blaster tests on the home’s HVAC system. Tests require 4 hours of work.
- Visitation to be coordinated for time appropriate to you.
- Visitation to occur prior to May 28, 2016.
- A Campbell Scientific micro-computer and temperature, relative humidity and moisture pin instruments will be installed in the attic. The Micro-computer will include its own independent cellular communication which will not interface with wireless communication in the home. (Installation of the micro-computer and instruments will require about 2 hours of work in the attic)
- Cellular communication will be separate from any WIFI or home phone system; it will not interface with the home’s wireless communication
- ORNL shall fully program the micro-computer while on site
- Data will be downloaded weekly using a cellular provider; contract purchased by ORNL
- In case of maintenance, ORNL shall request that UF contact the homeowner and if necessary visit the site and make appropriate correction to reestablish power to the micro-computer.
- Upon completion of the 1-year study the micro-computer will be removed from the home.
- All visits past the initial installation will be of 2 hour or less duration.
- The micro-computer will measure air temperature and relative humidity of the outdoor ambient, the indoor ambient and the attic ambient. The roof sheathing temperature and humidity and roof sheathing moisture content will also be recorded hourly for the duration of the study.
- A final report will be given each participating homeowner to use and make informed economic decisions for improving the efficiency of their home.
What happens if I do not want to be in this research?
Participation in research is completely voluntary. You can terminate participation at any time. If you sell your home, we would request you inform the new homeowner of the field study and ask their permission for researchers William Miller of ORNL or David Prevatt of the University of Florida to contact them.
What happens if I say yes, but I change my mind later?
You can leave the research at any time and it will not be held against you; however, request is made that all collected field data to the date of your withdrawal will be used to support the FBC in their advanced attic research. The micro-computer will be removed from your home at a time that is convenient for you.
Is there any way being in this study could be bad for me?
There is no risk to you during the study because we are simply collecting temperature, relative humidity and moisture data in the attic. Liability to the homeowner may occur during the blower door testing or installation of the micro-computer. A student may knock over a vase of lamp by accident. However, there is the potential for paint chipping around or on an air vent on the door frame used to mount the blower assembly. Minneapolis Blower Door equipment is designed to have no damage to the home. However, a wide plastic tape self-adheres to the supply and return grills of the HVAC during blower door testing. Removal of plastic tape could remove some paint if the grill is painted with latex paint. If paint is removed and you want it repaired, then UF and ORNL will have the item repainted by a painter of your choice. Damage to your furniture will be covered by UF and ORNL.
Will being in this study help me in any way?
Homeowners participating in this study will receive valuable information documenting the efficiency of their home. All findings will be documented in a report that each participating homeowner can use to make informed economic decisions for improving the efficiency of their home.
What happens to the information collected for the research?
Efforts will be made to limit the use and disclosure of your personal information. Home address will be held confidential. The field data will be public domain. We cannot promise complete secrecy. Organizations that may inspect and copy your information include the IRB, the University of Florida (UF) and the Florida Building Commission. However, information about the homes will be coded as follows:
- Home 1: Asphalt Shingle roof with ocSPF sealed attic
- Home 2: Standing Seal Metal roof with ocSPF sealed attic
- Home 3: Concrete tile roof with ocSPF sealed attic
- Home 4: Asphalt Shingle roof with ccSPF sealed attic
What else do I need to know?
This research is being funded by the Florida Building Commission which runs on a Fiscal year starting July 1. Work on the setup of the demonstrations must be completed by May 31, 2016.
- APPENDIX C: HOMEOWNER QUESTIONNAIRE
The homeowner questionnaires for all four houses can be accessed below:
House 1:
House 2:
House 3:
House 4:
ZIP SYSTEM PRODUCT INFORMATION: CLICK HERE
ZIP SYSTEM WARRANTY INFORMATION: CLICK HERE